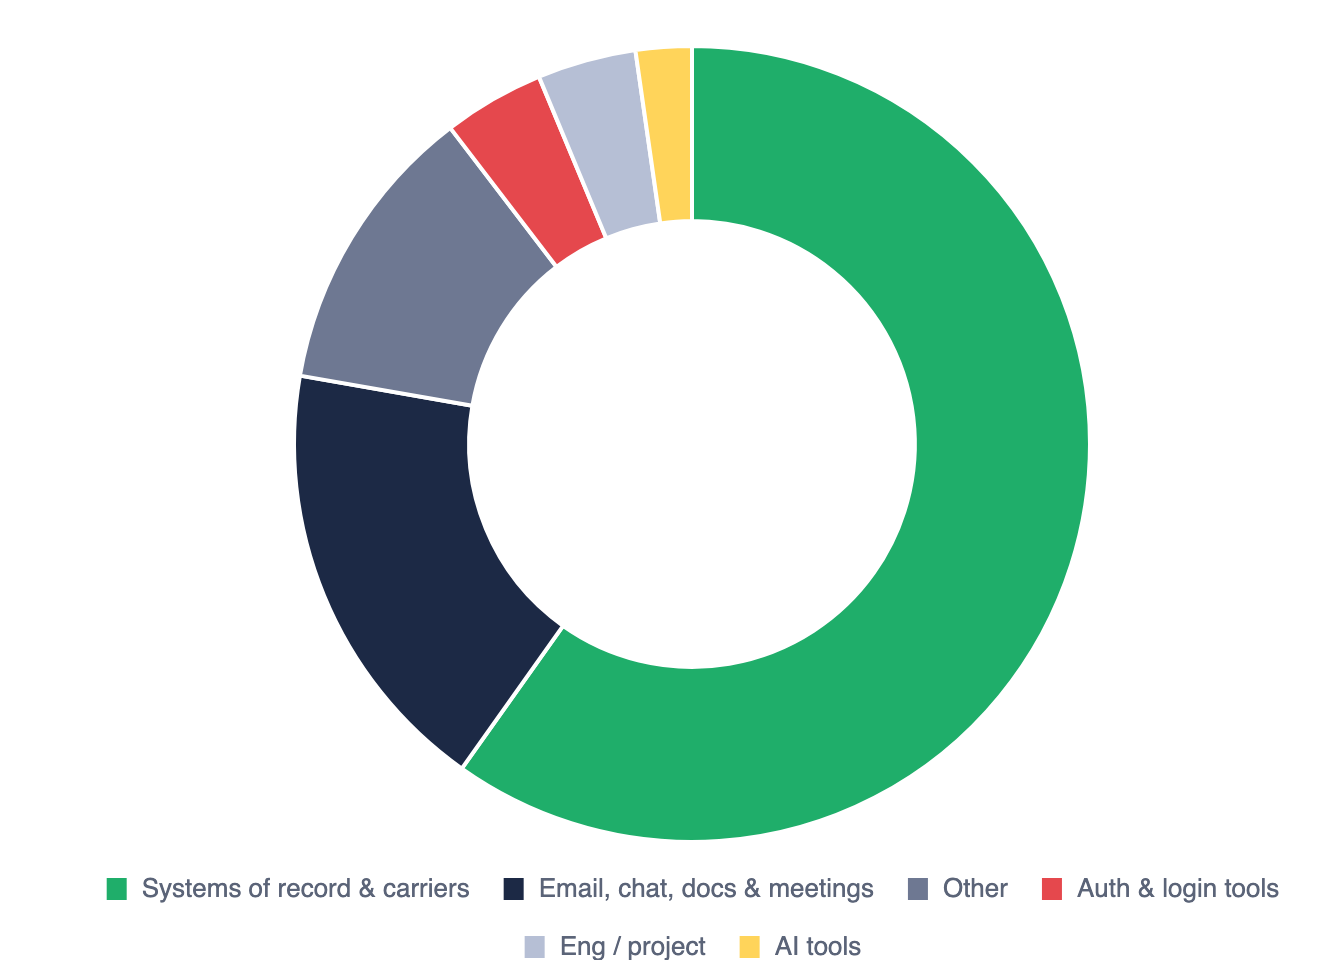
One week of real service activity across multiple mid-sized P&C agencies, drawn from a record of more than 10 million data points. See where the day really goes, and what it costs.
We ran BEX across many carriers and multiple mid-sized P&C agencies, then turned it into one clear read on where service time really goes. The specifics stay in the report. Here is what you will find inside:
Adjusted for volume, one carrier's portal can take up to ten times longer per completed task than another. See which ones drain your team.
How much of the average person's day disappears into carrier portals, tab-switching, and simply logging in, measured minute by minute.
How many times a day a rep hand-carries the same details between systems, and where that turns into rework and errors.
The specific workflows and carriers where automation returns the most hours, so you start where the payoff is biggest.
The share of routine service work that can move off your team now, broken down by task type and carrier.
How a mid-sized agency's service day actually breaks down, so you can hold your own operation up against it.
A short, visual report. Fill out the form and it opens right away.
Get the report
Read the full data report, or book a walkthrough of BEX and the COVU Stack on your own book.